Popular Vendors
Demo Microsoft MO-201 Exam Questions
Demo practice questions for guest users.
Question 1
SIMULATION Instructions Exam Environment Exam Interface and Controls The exam panel provides access to the project task(s). Each project has an associated file in which you will perform the project tasks.
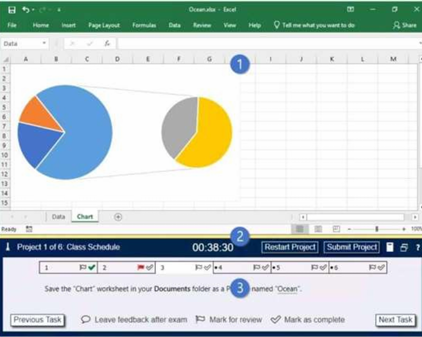
1. Project file 2. Split bar 3. Exam panel You can modify the exam interface to fit your needs in the following ways: • To increase or decrease the exam panel font size, press Ctrl+Plus or Ctrl+Minus. • To change the height of the exam panel, drag the split bar between the project file and the exam panel. • To minimize the exam panel, click the Collapse Panel arrow in the upper-left corner of the exam panel. The minimized exam panel displays the Expand Panel button, the project number and name, the remaining time, and the Restart Project and Submit Project buttons. To move between tasks, you must expand the exam panel. • To restore the interface to the default appearance, click the Restore button near the upper-right corner of the exam panel.
4. The Information bar at the top of the exam panel displays the current project and total number of Reference: projects, the remaining exam time, and the following commands: • Collapse Panel. Minimizes the exam panel to provide more space for the project file.
• Restart Project. Closes and reopens the current project file without saving your changes. • Submit Project. Saves your changes, submits the project file, and moves to the next project. • Calculator. A calculator is available in some exams. You are not required to use the calculator. • Restore. Restores the size and position of the project file and exam panel to the defaults. • Help. Displays information about the exam interface. 5. The Content area displays the task tabs and the current task description. 6. The Navigation area at the bottom of the exam panel contains the following commands. • Previous Task/Next Task. Saves your response and moves to the previous or next task in the current project. • Leave feedback after exam. Flags the task to indicate that you want to leave feedback about it after the exam. • Mark for review. Flags the task to indicate that you want to return to it before you finish the exam. • Mark as complete. Flags the task to indicate that you feel you have completed the task. In projects that contain multiple tasks, you can switch between tasks by clicking the task tab, Next Task button, or Previous Task button. End of the instructions. You are creating a workbook for the regional meeting of Southridge Video. On the “Regional Sales” worksheet, in cells D4:F7, use the Fill Series feature to complete the sales projections using a linear growth rate of 500,000 per year.
Correct Answer: A
Explanation:
https://support.microsoft.com/en-us/office/project-values-in-a-series-5311f5cf-149e-4d06-81dd- 5aaad87e5400
Question 2
SIMULATION Instructions Exam Environment Exam Interface and Controls Questions & Answers PDF Page 9 The exam panel provides access to the project task(s). Each project has an associated file in which you will perform the project tasks.
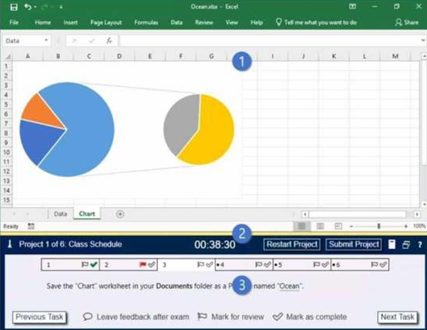
1. Project file
2. Split bar
3. Exam panel
You can modify the exam interface to fit your needs in the following ways:
• To increase or decrease the exam panel font size, press Ctrl+Plus or Ctrl+Minus.
• To change the height of the exam panel, drag the split bar between the project file and the exam
panel.
• To minimize the exam panel, click the Collapse Panel arrow
in the upper-left corner of the
exam panel. The minimized exam panel displays the Expand Panel button, the project number and
name, the remaining time, and the Restart Project and Submit Project buttons. To move between
tasks, you must expand the exam panel.
• To restore the interface to the default appearance, click the Restore button near the upper-right
corner of the exam panel.
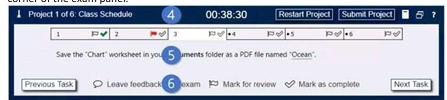
4. The Information bar at the top of the exam panel displays the current project and total number of projects, the remaining exam time, and the following commands:
• Collapse Panel. Minimizes the exam panel to provide more space for the project file.
• Restart Project. Closes and reopens the current project file without saving your changes.
• Submit Project. Saves your changes, submits the project file, and moves to the next project.
• Calculator. A calculator is available in some exams. You are not required to use the calculator.
• Restore. Restores the size and position of the project file and exam panel to the defaults.
• Help. Displays information about the exam interface.
5. The Content area displays the task tabs and the current task description.
6. The Navigation area at the bottom of the exam panel contains the following commands.
• Previous Task/Next Task. Saves your response and moves to the previous or next task in the current
project.
• Leave feedback after exam. Flags the task to indicate that you want to leave feedback about it after
the exam.
• Mark for review. Flags the task to indicate that you want to return to it before you finish the exam.
• Mark as complete. Flags the task to indicate that you feel you have completed the task.
In projects that contain multiple tasks, you can switch between tasks by clicking the task tab, Next
Task button, or Previous Task button.
End of the instructions.
On the “Volunteer Analysis” chart sheet, drill down into the data to display the number of volunteer
hours for each month.
4. The Information bar at the top of the exam panel displays the current project and total number of projects, the remaining exam time, and the following commands: • Collapse Panel. Minimizes the exam panel to provide more space for the project file. • Restart Project. Closes and reopens the current project file without saving your changes. • Submit Project. Saves your changes, submits the project file, and moves to the next project. • Calculator. A calculator is available in some exams. You are not required to use the calculator. • Restore. Restores the size and position of the project file and exam panel to the defaults. • Help. Displays information about the exam interface. 5. The Content area displays the task tabs and the current task description. 6. The Navigation area at the bottom of the exam panel contains the following commands. • Previous Task/Next Task. Saves your response and moves to the previous or next task in the current project. • Leave feedback after exam. Flags the task to indicate that you want to leave feedback about it after the exam. • Mark for review. Flags the task to indicate that you want to return to it before you finish the exam. • Mark as complete. Flags the task to indicate that you feel you have completed the task. In projects that contain multiple tasks, you can switch between tasks by clicking the task tab, Next Task button, or Previous Task button. End of the instructions. On the “Volunteer Analysis” chart sheet, drill down into the data to display the number of volunteer hours for each month.
Correct Answer: A
Explanation:
When a chart contains multiple fields in the Axis area (for example: Country → State → City), Power View creates a hierarchy.
When a chart contains multiple fields in the Axis area (for example: Country → State → City), Power View creates a hierarchy.
Initially, the chart displays only the top level of the hierarchy. To view the lower levels, you must enable drill-down.
How Drill-Down Works-
Select the chart.
-
Go to the Design tab.
-
Click Show Levels.
-
Select Enable Drill Down One Level at a Time.
Once drill-down is enabled:-
The chart displays the highest level in the hierarchy.
- Double-clicking a bar, column, or data point drills into that item.
-
The chart then shows the underlying (child) level data for the selected item.
Example
Suppose the hierarchy is:-
Country
-
State
-
City
Initially, the chart shows:-
USA
-
Canada
-
Mexico
If you double-click USA, the chart drills down and displays:-
California
-
Texas
-
Florida
If you then double-click California, it displays:-
Los Angeles
-
San Diego
-
San Francisco
Key Point for Exams
Drill-down allows users to navigate from summary-level data to more detailed underlying data by double-clicking chart elements after enabling "Drill Down One Level at a Time." This helps analyze data hierarchies interactively.
Question 3
SIMULATION Instructions Exam Environment Exam Interface and Controls The exam panel provides access to the project task(s). Each project has an associated file in which you will perform the project tasks.
1. Project file 2. Split bar 3. Exam panel You can modify the exam interface to fit your needs in the following ways: To increase or decrease the exam panel font size, press Ctrl+Plus or Ctrl+Minus. To change the height of the exam panel, drag the split bar between the project file and the exam panel. To minimize the exam panel, click the Collapse Panel arrow in the upper-left corner of the exam panel. The minimized exam panel displays the Expand Panel button, the project number and name, the remaining time, and the Restart Project and Submit Project buttons. To move between tasks, you must • expand the exam panel. To restore the interface to the default appearance, click the Restore button near the upper-right corner of the exam panel.
4. The Information bar at the top of the exam panel displays the current project and total number of
projects, the remaining exam time, and the following commands: • Collapse Panel. Minimizes the exam
panel to provide more space for the project file. • Restart Project. Closes and reopens the current
project file without saving your changes. • Submit Project. Saves your changes, submits the project file,
and moves to the next project. • Calculator. A calculator is available in some exams. You are not
required to use the calculator.
• Restore. Restores the size and position of the project file and exam panel to the defaults.
• Help. Displays information about the exam interface.
5. The Content area displays the task tabs and the current task description. 6. The Navigation area at
the bottom of the exam panel contains the following commands.
• Previous Task/Next Task. Saves your response and moves to the previous or next task in the current
project.
• Leave feedback after exam. Flags the task to indicate that you want to leave feedback about it after
the exam.
• Mark for review. Flags the task to indicate that you want to return to it before you finish the exam.
• Mark as complete. Flags the task to indicate that you feel you have completed the task.
In projects that contain multiple tasks, you can switch between tasks by clicking the task tab, Next
Task button, or Previous Task button.
End of the instructions.
On the “Summary” worksheet, starting in cell A4, consolidate data from the 2014-2018 “by Region”
worksheets. Display the average number of the “Recreation Visits” for each “Region”. Use labels in
both the top row and left column.
Delete the blank “Park Name” column from the consolidated data.
Correct Answer: A
Explanation:
Data Consolidation in Excel allows you to combine data from multiple worksheets or workbooks into a single summary worksheet. This is useful when you have similar data stored in different sheets (such as monthly sales reports) and want to create a consolidated report.
Data Consolidation in Excel allows you to combine data from multiple worksheets or workbooks into a single summary worksheet. This is useful when you have similar data stored in different sheets (such as monthly sales reports) and want to create a consolidated report.
Steps to Consolidate Data- Open all worksheets that contain the data you want to combine.
-
Ensure each worksheet uses the same layout and structure:
-
Labels should be in the same rows and columns.
-
Data ranges should be organized consistently.
-
Remove any unnecessary blank rows or columns.
-
Create or open a Summary worksheet where the consolidated data will appear.
-
Select the cell where you want the consolidated data to begin.
-
Go to the Data tab and click Consolidate in the Data Tools group.
-
In the Function drop-down list, choose how the data should be combined:
- Sum – Adds values together.
- Average – Calculates averages.
- Count – Counts entries.
- Min/Max – Finds minimum or maximum values.
-
Under Reference, select the data range from the first worksheet and click Add.
-
Repeat the process for all worksheets or workbooks you want to include.
-
If your data contains labels:
-
Check Top row if labels are in the first row.
-
Check Left column if labels are in the first column.
-
(Optional) Select Create links to source data if you want the summary to update automatically when source data changes.
-
Click OK.
Excel will create a consolidated table in the Summary worksheet.
Explanation of F5 → Go To Special
After opening a spreadsheet:-
Press F5 on the keyboard.
-
The Go To dialog box appears.
-
Click Special.
The Go To Special feature allows you to quickly select specific types of cells, such as:-
Blank cells
-
Formulas
-
Constants
-
Comments/Notes
-
Conditional formatting
-
Visible cells only
-
Objects
This feature is commonly used for data cleaning, auditing formulas, and managing large worksheets efficiently.
Key Exam Point- Consolidate combines data from multiple worksheets into a summary worksheet.
- F5 → Special opens Go To Special, which helps select specific cell types for editing or analysis.