Demo WGU Applied Algebra Exam Questions
Demo practice questions for guest users.
Question 1
Correct Answer: D
Explanation:
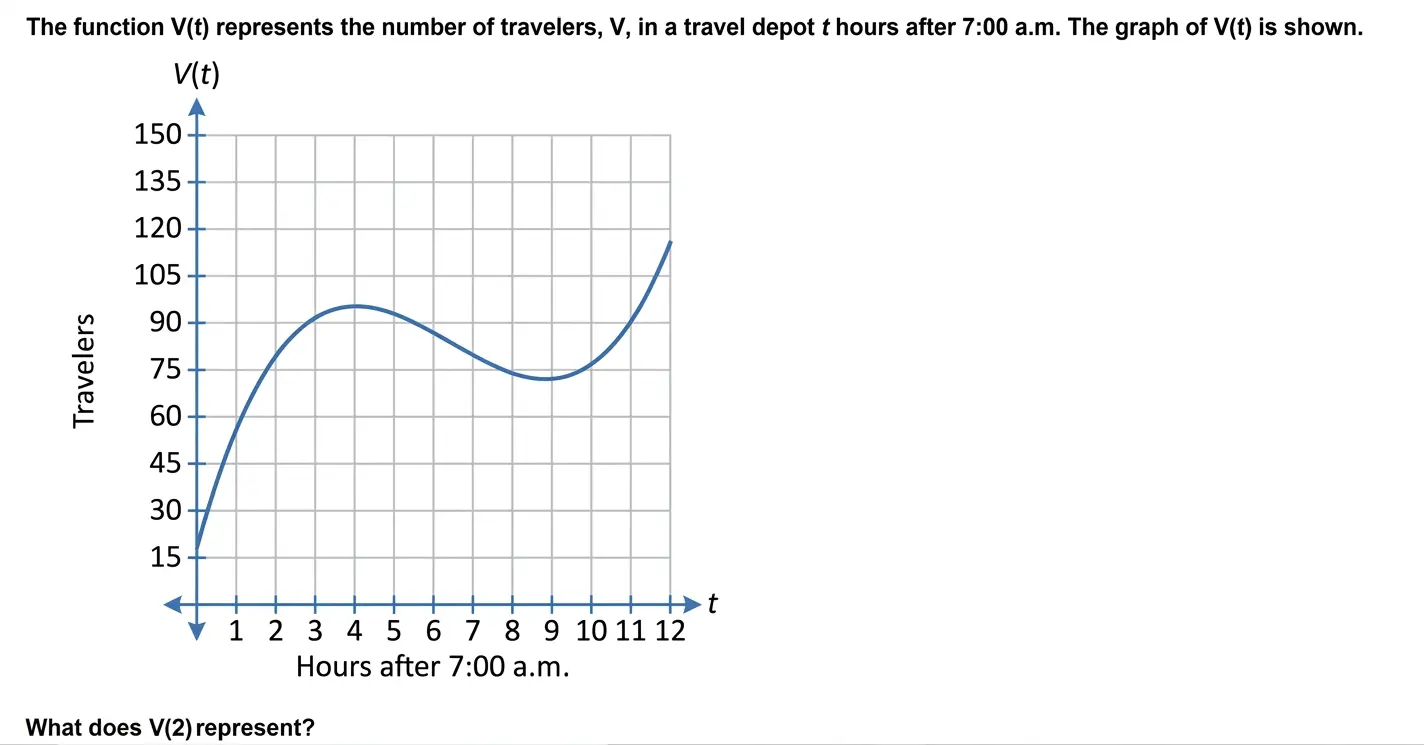
he function V(t)represents the number of travelers in the travel depot.
he function V(t)represents the number of travelers in the travel depot.
The input trepresents:
" hours after 7:00 a.m. "
The output V(t)represents:
" number of travelers "
So V(2)means the number of travelers in the depot:
2 " hours after 7:00 a.m. "
From the graph, when:
t=2
the value of V(t)is approximately:
79.2
Since V(t)measures travelers, not hours, V(2)represents:
79.2 " travelers "
Therefore, the correct answer is:
▭ ( " D " )
Question 2
Correct Answer: A
Explanation:
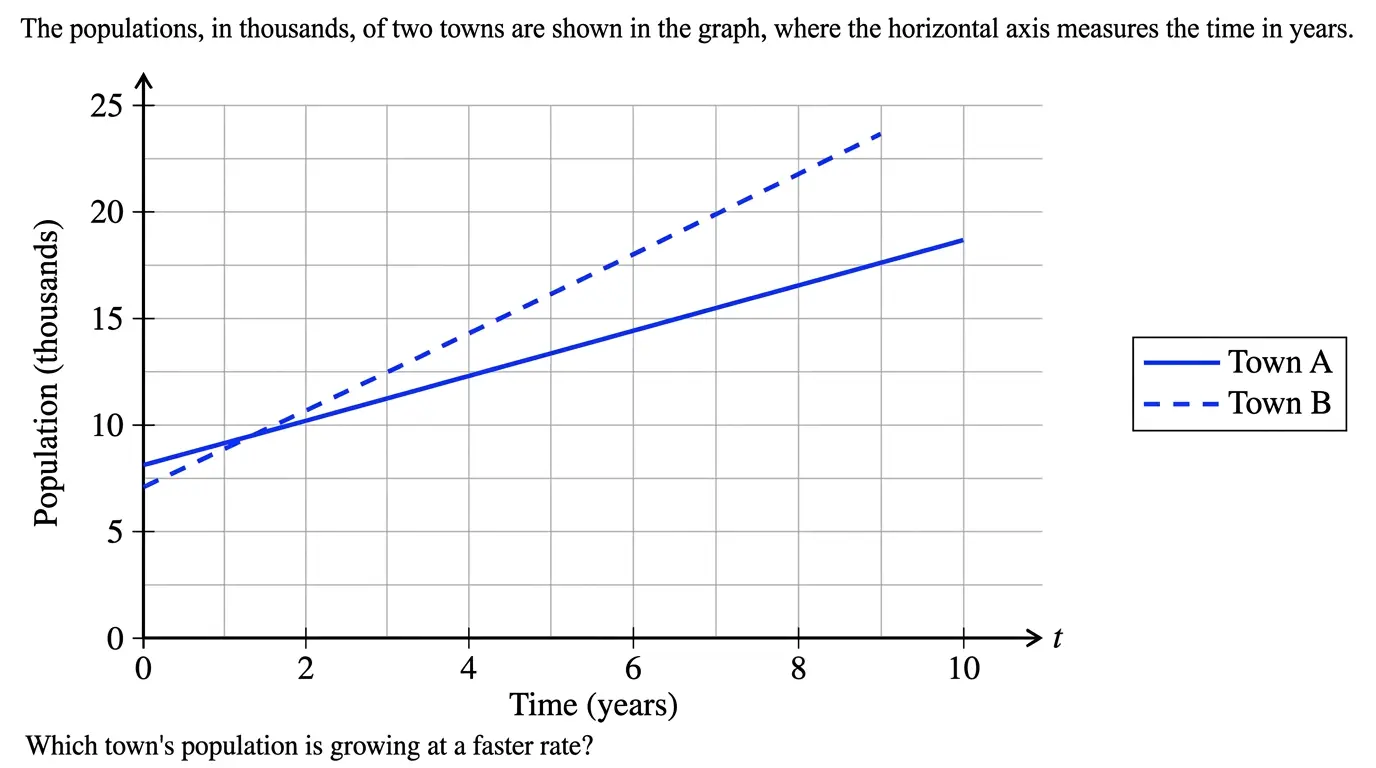
he graph compares the populations of two towns over time.
he graph compares the populations of two towns over time.
The horizontal axis represents:
" Time in years "
The vertical axis represents:
" Population in thousands "
The graph shows:
Town A as the solid blue line.
Town B as the dashed blue line.
To determine which town’s population is growing faster, we compare the slopes of the two lines.
In Applied Algebra, the slope of a line represents the rate of change:
" slope " = " change in population " / " change in time "
From the graph:
" Town A grows at about " 0.9 " thousand people per year "
" Town B grows at about " 1.6 " thousand people per year "
Now compare the growth rates:
1.6 > 0.9
So Town B’s population is growing at a faster rate.
The values 8.0and 6.5describe starting populations, not growth rates. Since the question asks about growing at a faster rate, we must compare the slopes.
Question 3
Correct Answer: A
Explanation:
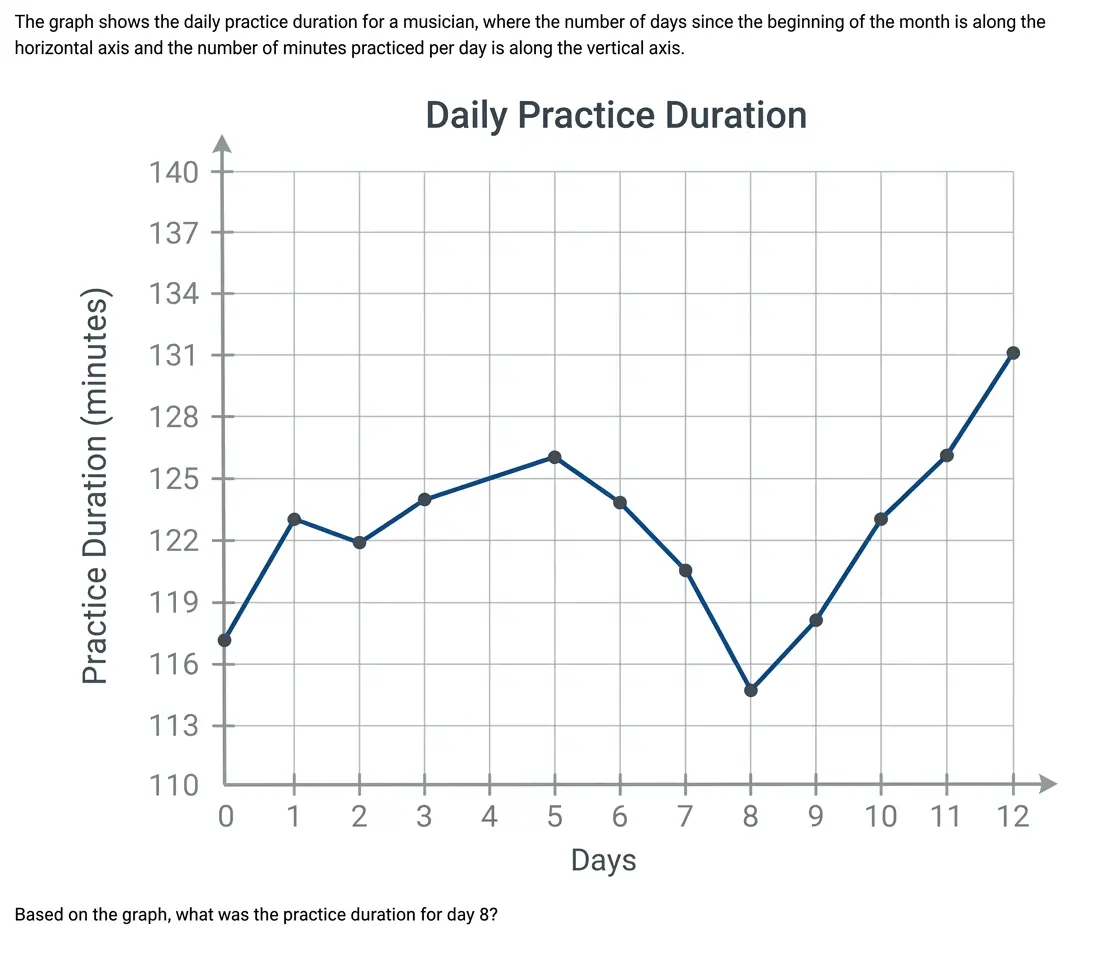
This question asks us to interpret a value from a graph.
This question asks us to interpret a value from a graph.
The horizontal axis represents:
Days
The vertical axis represents:
Practice duration in minutes
We need to find the practice duration on day 8.
To do this:
Locate 8 on the horizontal axis.
Move vertically until you reach the blue graph.
Read the corresponding value on the vertical axis.
From the graph, when:
x=8
the blue graph is at:
y=115
So the musician practiced for:
115 minutes